
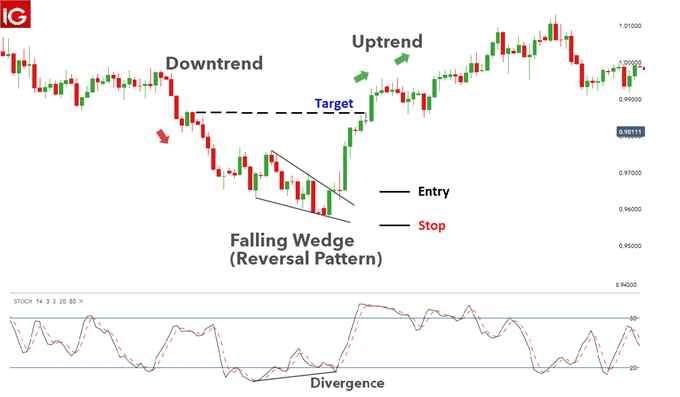
In technical analysis, a descending wedge pattern is a chart pattern that signals that the previous downtrend is coming to an end and that prices are likely to start rising.
Falling wedge patterns can form in any timeframe, from intraday to monthly charts. However, they are most commonly seen on daily or weekly charts. When interpreting this pattern, it is important to look at the overall price trend leading up to the formation of the pattern as well as the volume levels. A true falling wedge pattern should form in a downtrend and should see decreasing volume levels as the pattern forms. This is because the buyers are slowly but surely gaining control of the market and pushing prices higher.
Where Does the Falling Wedge Occur?
The Descending (or falling) wedge does not randomly occur. It is seen after a brief correction or negative trend and shows the strengths of bulls above bears in the market actions. A look at volume shows that there is first a reduction due to selling pressure before buyers, who have been kept at bay, come in full force, causing a trend reversal or continuation of the previous trend.
Spotting the Falling Wedge
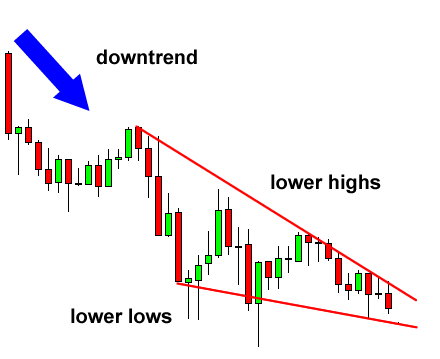
A chart must present three things for the downward pattern to be established.
- There must be two lower highs and two or three lower lows. This will prove that the price is not oversold.
- Both the upper and lower trend lines must converge.
- Volume must shrink at this point.
Trading the Falling Wedge
There are several things you note to trade the falling Wedge pattern effectively. Since this pattern can signal a continuation or reversal, there are specific things to note here. Often, the pattern is a way to identify a market bottom, and it needs a breakout and low volume as confirmation.
- Your trendline is the first important part of the wedge pattern. You need to identify your lower lows and lower highs on the chart.
- Watch for a price breakout from the trendlines.
- Be careful here, as the price often comes back to test the wedge.
- Your stop loss should be placed on the opposite side of the breakout, and your Take profit should be placed where the wedge is thickest.
Pros and Risks of the Falling Wedge
Pros
- In trend continuation, the FWP can be seen as a second chance for traders to profit from the upward trend. With a good placement of stop loss, traders are not trapped if the chart does not eventually continue.
- This is one of the few patterns that can be traded across several financial assets, giving traders a good chance to profit outside the crypto market.
- The entry, Take profit, exit, and stop loss targets are clearly defined, offering an excellent risk-reward ratio.
Risks
- The pattern, in itself, can be misleading. Further confirmation from other indicators like oscillators makes it a good one to make profits effectively.
- The pattern is not beginner-friendly as it shows semblance to some other patterns.
- The pattern is not effective for smaller time frames.
Key Takeaways
- The opposite of the Falling wedge pattern is the rising wedge pattern
- Lower lows and lower highs are two important things in identifying a falling wedge pattern
- The falling wedge can either indicate a continuation or a reversal
- Exchanges like Redot have advanced features that make spotting this pattern easy.
FAQ
Is this Pattern Bullish or Bearish?
This pattern is bullish. Although it can be seen at the bottom of a bear market, signaling the end of the downward trend, it is always a prelude to a bullish trend.
What is a Rising Wedge?
A rising wedge pattern is created when the price of an asset moves up in a narrowing range. This pattern is considered bearish, as it typically signals that the asset is about to enter a downtrend.
This pattern can be used in any time frame, although it is more commonly seen on longer-term charts. Rising wedges typically form during bullish periods as investors buy the asset in anticipation of further price increases. However, the pattern can signify that the rally is losing steam and the price is about to head lower.