
Infographic design has definitely caught on, but that doesn’t mean we’ve mastered it yet. The web is still littered with messy and clunky infographics. So why do these problems exist and how can we solve them? I’ve put together a list of the five primary reasons infographics can turn out less than stellar, along with ways you can fix them.
1. Poor organization.
The biggest design problem I see is an overall poor layout for the information being conveyed, especially if it’s a complex graphic that includes many pieces of data or images to explain it. If there are 10 ideas to explain in your infographic, don’t try to shove all 10 ideas into a single space.
Spread them out and allow white space to help the idea breathe. If you must include everything in one place, don’t be afraid to re-arrange your information so that it’s organized better. For example, imagine you have an infographic about women’s rights around the world. You want to include pieces on gender, sexuality, reproductive health, and politics. If you put everything into one place, your infographic will look like a mess.
Instead, separate the information so that it looks cleaner and conveys its ideas better. In this case, I would break up all four topics into individual infographics with images from Getty Images to illustrate each point.
2. Too many images or poor-quality images.
Images have one purpose: to break up text and break up long stretches of content. If you’re a designer, take a look at any infographic you find that has a ton of images and ask yourself why they are there. Are the images helping to convey the concept? Chances are in a graphic that has too many images, the quality of the images is poor and they don’t add much to the content.
High-quality infographics will use minimal imagery. If you’re going to use an image, make sure it’s crystal clear and conveys your point better than text alone could do. Don’t get lazy and use stock photography.
3. Poorly designed text elements or callouts.
The text in infographics can be tricky to design and should be considered as carefully as the other pieces of the graphic. Chances are if yours looks like word vomit, you probably need to go back and rethink your choices.
Text elements and callouts should always be composed of short, concise phrases. If you’re trying to explain a complicated concept such as the water cycle, the text must be simple enough for someone who doesn’t know anything about it to understand. Details can be included in an explanation below the graphic or in the caption if needed, but the text itself must be simple.
4. Ugly color schemes or color palette washes everything out.
A great infographic doesn’t need a ton of colors, but it should have a cohesive color scheme that holds the piece together and makes sense. Imagine seeing a graphic with six different shades of blue used in different areas of the illustration. It wouldn’t look great, would it?
The colors you choose should always complement the topic. If you’re doing an infographic about makeup then pink and red are probably your best bets for a color palette because that’s what people think of when they think of makeup products. On the other hand, if you were doing an infographic about heart disease, red probably isn’t the best color option.
5. No white space or too much white space.
When it comes to infographics, white space is your friend. White space helps break up text and images so that readers aren’t overwhelmed by information overload from a single page. It also makes it easier for readers to take in all the information on an infographic.
Too much white space can have the opposite effect, readers will feel uncomfortable with so much empty space. A good rule of thumb is to use up no more than 75% of your virtual real estate when designing an infographic.
One great tip when making infographics is to use Venngage — a free infographic maker that provides a wide range of infographic templates for everyone. Here are some cool infographic examples from their website!

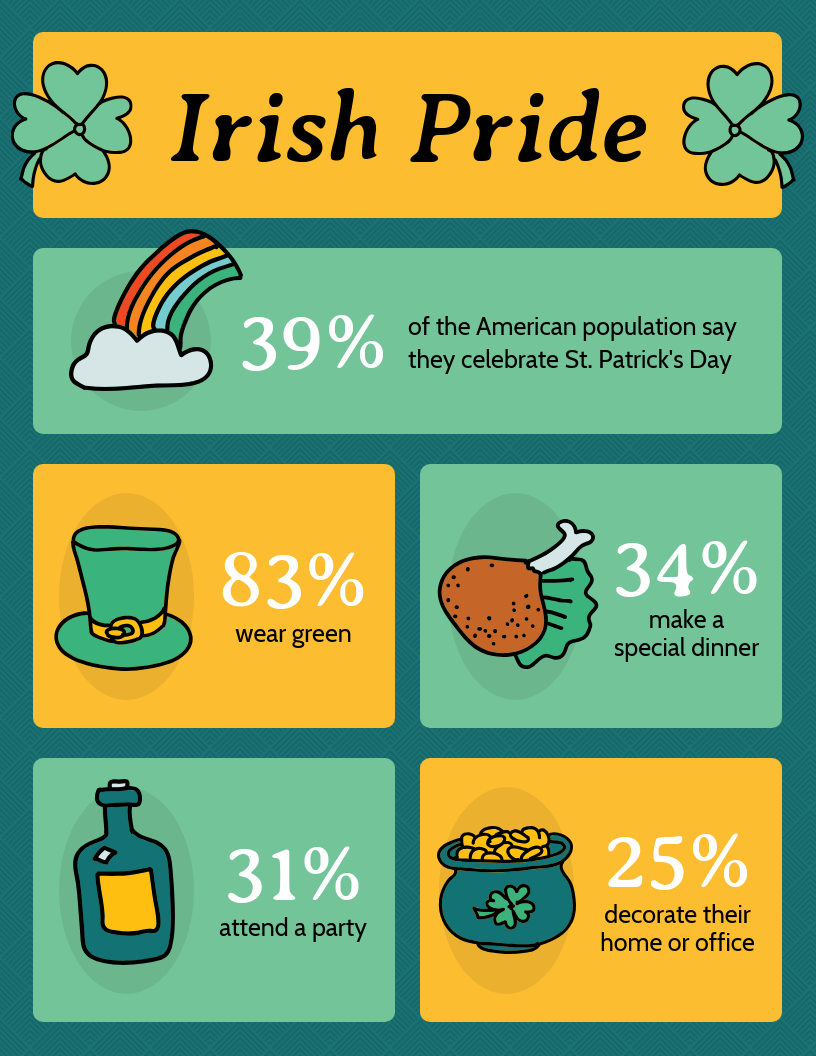
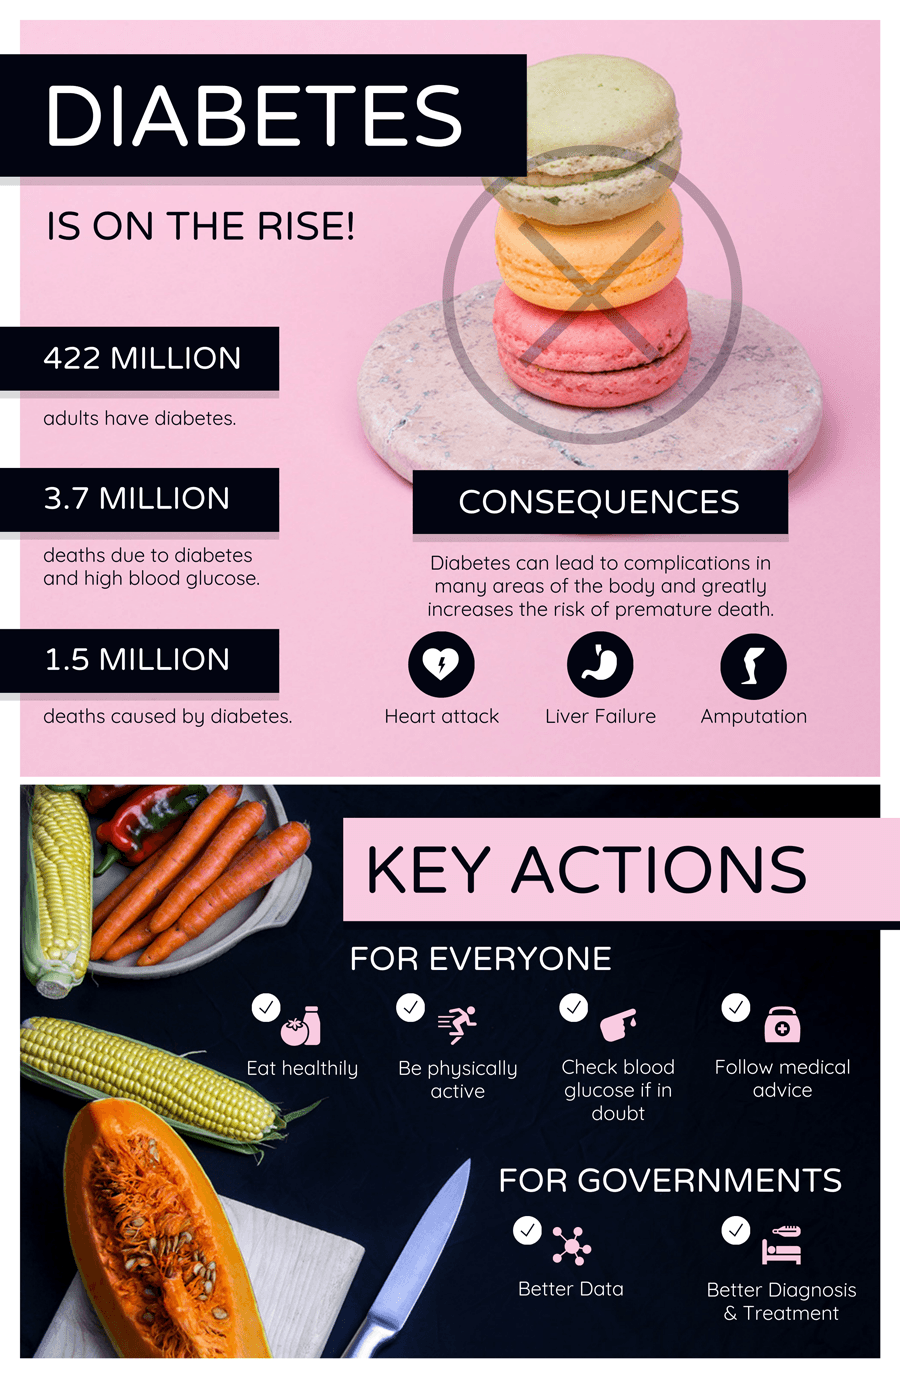
So there you have it, some easy-to-follow guidelines that will help you avoid some of the most common infographic mistakes. A lot of people are intimidated by infographics because they think they’re too hard to create, but with proper learning and the use of Venngage infographics, anyone can design a great visual. What are you waiting for? Use all your learnings from this article and make an infographic now!