Big data is a recent phenomenon that refers to the large amount of data that is being generated by different data points today. In fact, the amount of data available today far outpaces anything we have ever seen before with entire data centres created just to cater for this influx. All this data is useless unless it can be converted into useful information and this very need gave birth to data scientists. To be able to turn data into information, data scientist skills includes a diverse skill set all of which must present data in a useful manner. One of the strongest skill sets in this regard is that of data visualisation.
Due to the ubiquitous nature of big data, companies big and small are looking at hiring data scientists to increase their competitive advantage in a market where data is everything. To this end, Python is proving to be one of the strongest languages in data science providing a strong and flexible tool that allows for strong data visualizations within a robust framework.
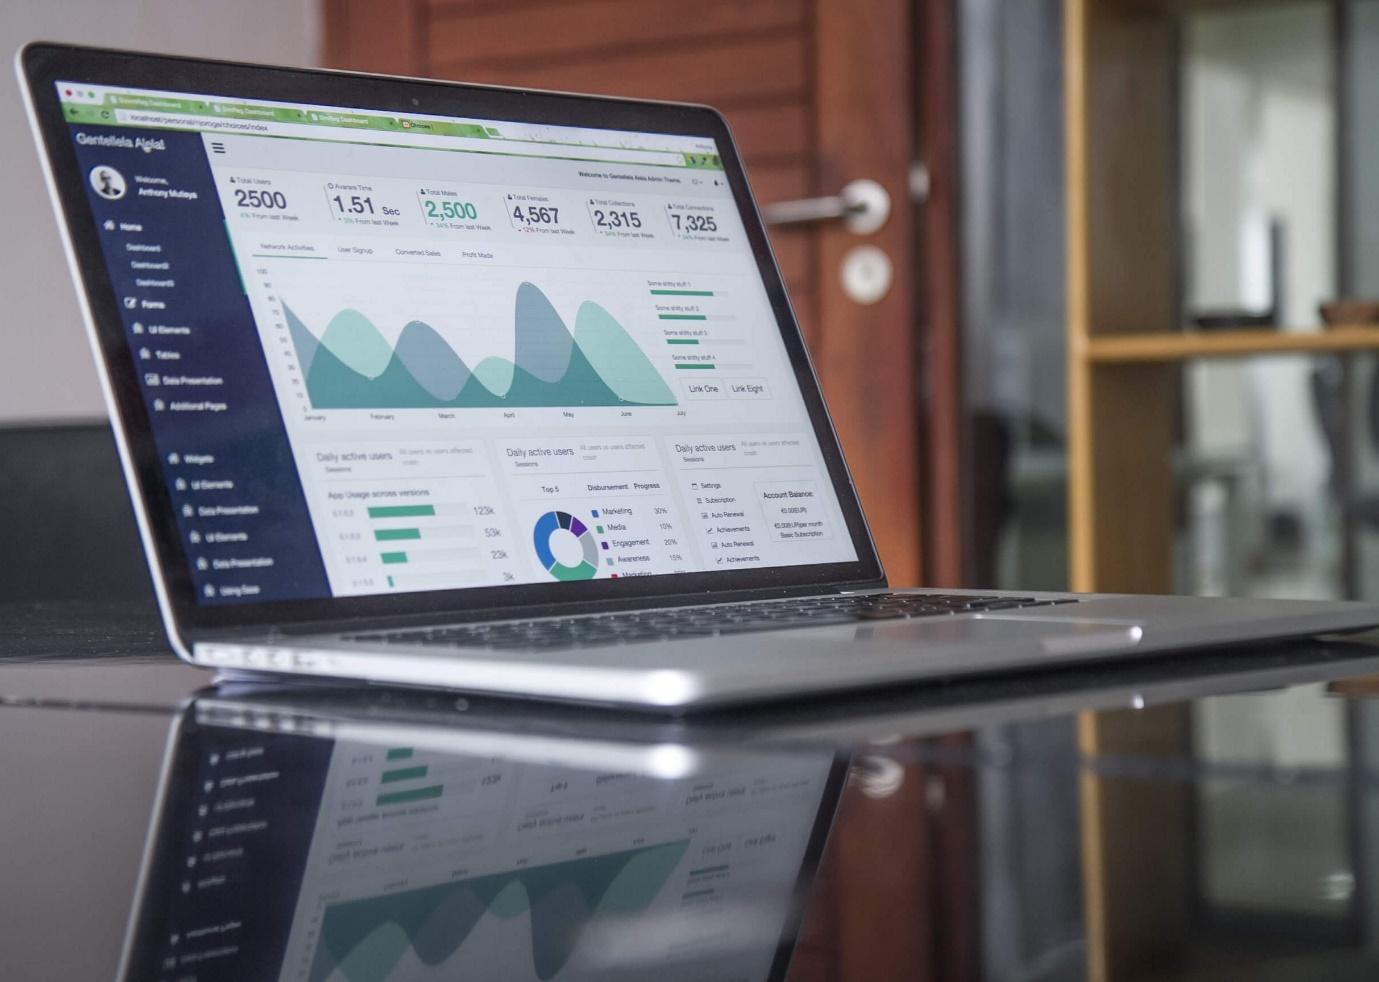
Data visualization makes the consumption of complex data much easier, giving business decision makers a clearer picture of what can be a very complex picture. It is important, therefore, for aspiring data scientists to understand the fundamentals of data visualization which Python can help you achieve.
Data visualization is a modern version of visual communication and it involves the creation and subsequent study of the visual representations of data. Data visualization’s aim is to help in the communication of information efficiently and clearly, using a variety of tools including information graphics, statistical graphics, and plots amongst others. To visually communicate quantitative messages, numerical data can be encoded using lines, dots, or bars. When effectively carried out, this can help businesses to analyse and reason the data provided by making the available information easier to understand and more accessible to be able to make the right decisions.
Characteristics of information graphics
Information graphics are there to support analytical tasks, more so when users are making comparisons. Not all graphic elements are equally effective, with different data sets and different comparisons requiring different elements whether its bar charts, dot plots, or pie charts.
To maximize the effectiveness of an information graphic one should first and foremost understand what the graphic needs to achieve; too many times the end result ends up missing the point or tries to achieve too much. Also make sure that the graphic is showing the correct data, the design helps the user to focus on the data rather than the design or something else, and that the message is clear and without any distortion.
Data should also be organised logically; where it is revealed to the user in different levels of detail – from overview to a fine detail through the use of such things as filters and drilldowns. This is best achieved by having a clear purpose which will allow you as a data scientist to match the statistical and visual explanations that comes with it.
Quantitative messages
There are 8 main types of encoding numerical data into graphics:
- Time series: A variable is showed over a period of time using line chart.
- Ranking: Categories are ranked in descending or ascending order usually in the shape or bar chart.
- Part-to-whole: Categories are shown as a ratio to the whole in pie chart.
- Deviation: Categories are compared against a reference,(a bar chart representation can be used).
- Frequency distribution: Shows a variable for a given interval over a period of time(the best to use in this case is a histogram which is a type of bar chart).
- Correlation: Shows a comparison of two variables to analyse how they correlate (usually in scatter plot).
- Nominal comparison: Comparing categories with no particular order in bar chart.
- Geograp
hic or spatial: Comparing a variable across a map or another visual layout in a cartogram.
Pre-attentive attributes and data visualization
Since data visualization consumers are humans, it is very important
to understand how humans perceive and process visual information in order to maximize its effectiveness. Pre-attentive attributes are the subconscious information gathering processes that our brain does without any effort. Knowledge of pre-attentive attributes can help to create visuals that are understood by the user intuitively. As an example, human beings are very good at distinguishing the length of lines, colour, shape, and orientation without any effort. Thus through data visualisation we can shorten the processing time by using bars of different lengths and numbers in different colours. It is also known that humans process differences in lengths better than differences in surface areas, therefore bar charts are more effective than pie charts when comparisons need to be made.

Data science is a beautiful subject which combines elements of programming, mathematics, design, and human understanding. Due to the multi-faceted nature of data science, and the added complexity modern data entails, a strong framework that offers flexibility and extensibility is the holy grail of data scientists who have to increasingly processes larger and more complex data sets to be able to offer businesses an even wider competitive advantage.
To this end, Python has fast become the tool of choice, giving data scientists a flexible tool that can grow with their skills whilst providing excellent visualisations every step of the way. Python Course can quickly get you up to speed and with many opportunities available in this field, getting certified is sure to pay off quickly.
As companies continue to harness the benefits of data visualisation and the benefits it provides in data consumption, data visualisation experts will increasingly be in healthy demand making the comprehension and understanding of this science an important requirement in the jobs of tomorrow.